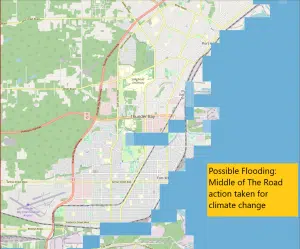
A new flood map outlines what the area could look if water levels continue to rise.
The hypothetical flooding was comprised with data from over 150 thousand documents from the Natural Sciences and Engineering Research Council of Canada (NSERC) and Prof. Slobodan P. Simonovic who is also a flood expert from Western University.
The data shows what flooding could look like in the next several decades, as well as beyond if climate change continues on the current trajectory if little to no action is taken.
There are different scenarios that you can choose in the map;
- SSP1: Sustainability (Taking the Green Road);
- SSP2: Middle of the Road;
- SSP3: Regional Rivalry (A Rocky Road);
- SSP4: Inequality (A Road divided);
- SSP5: Fossil-fueled Development (Taking the Highway)
You can see the various scenarios and the whole map here. A description of the various map options can be viewed here.

This picture is SSP2 for 2020-2060.


